Humans are visual creatures, with roughly 90 percent of our brain waves occurring as images. We think, envision and engage visually, which explains why infographics are so useful in marketing and sales. According to Digital Information World, infographics are 30 times more likely to be read in full than articles. Not only that; Xerox says infographics can increase sales by up to 80 percent.
When should you use infographics? Any time you are trying to communicate relatively complex information, consider switching from written to visual content. Here are a few examples:
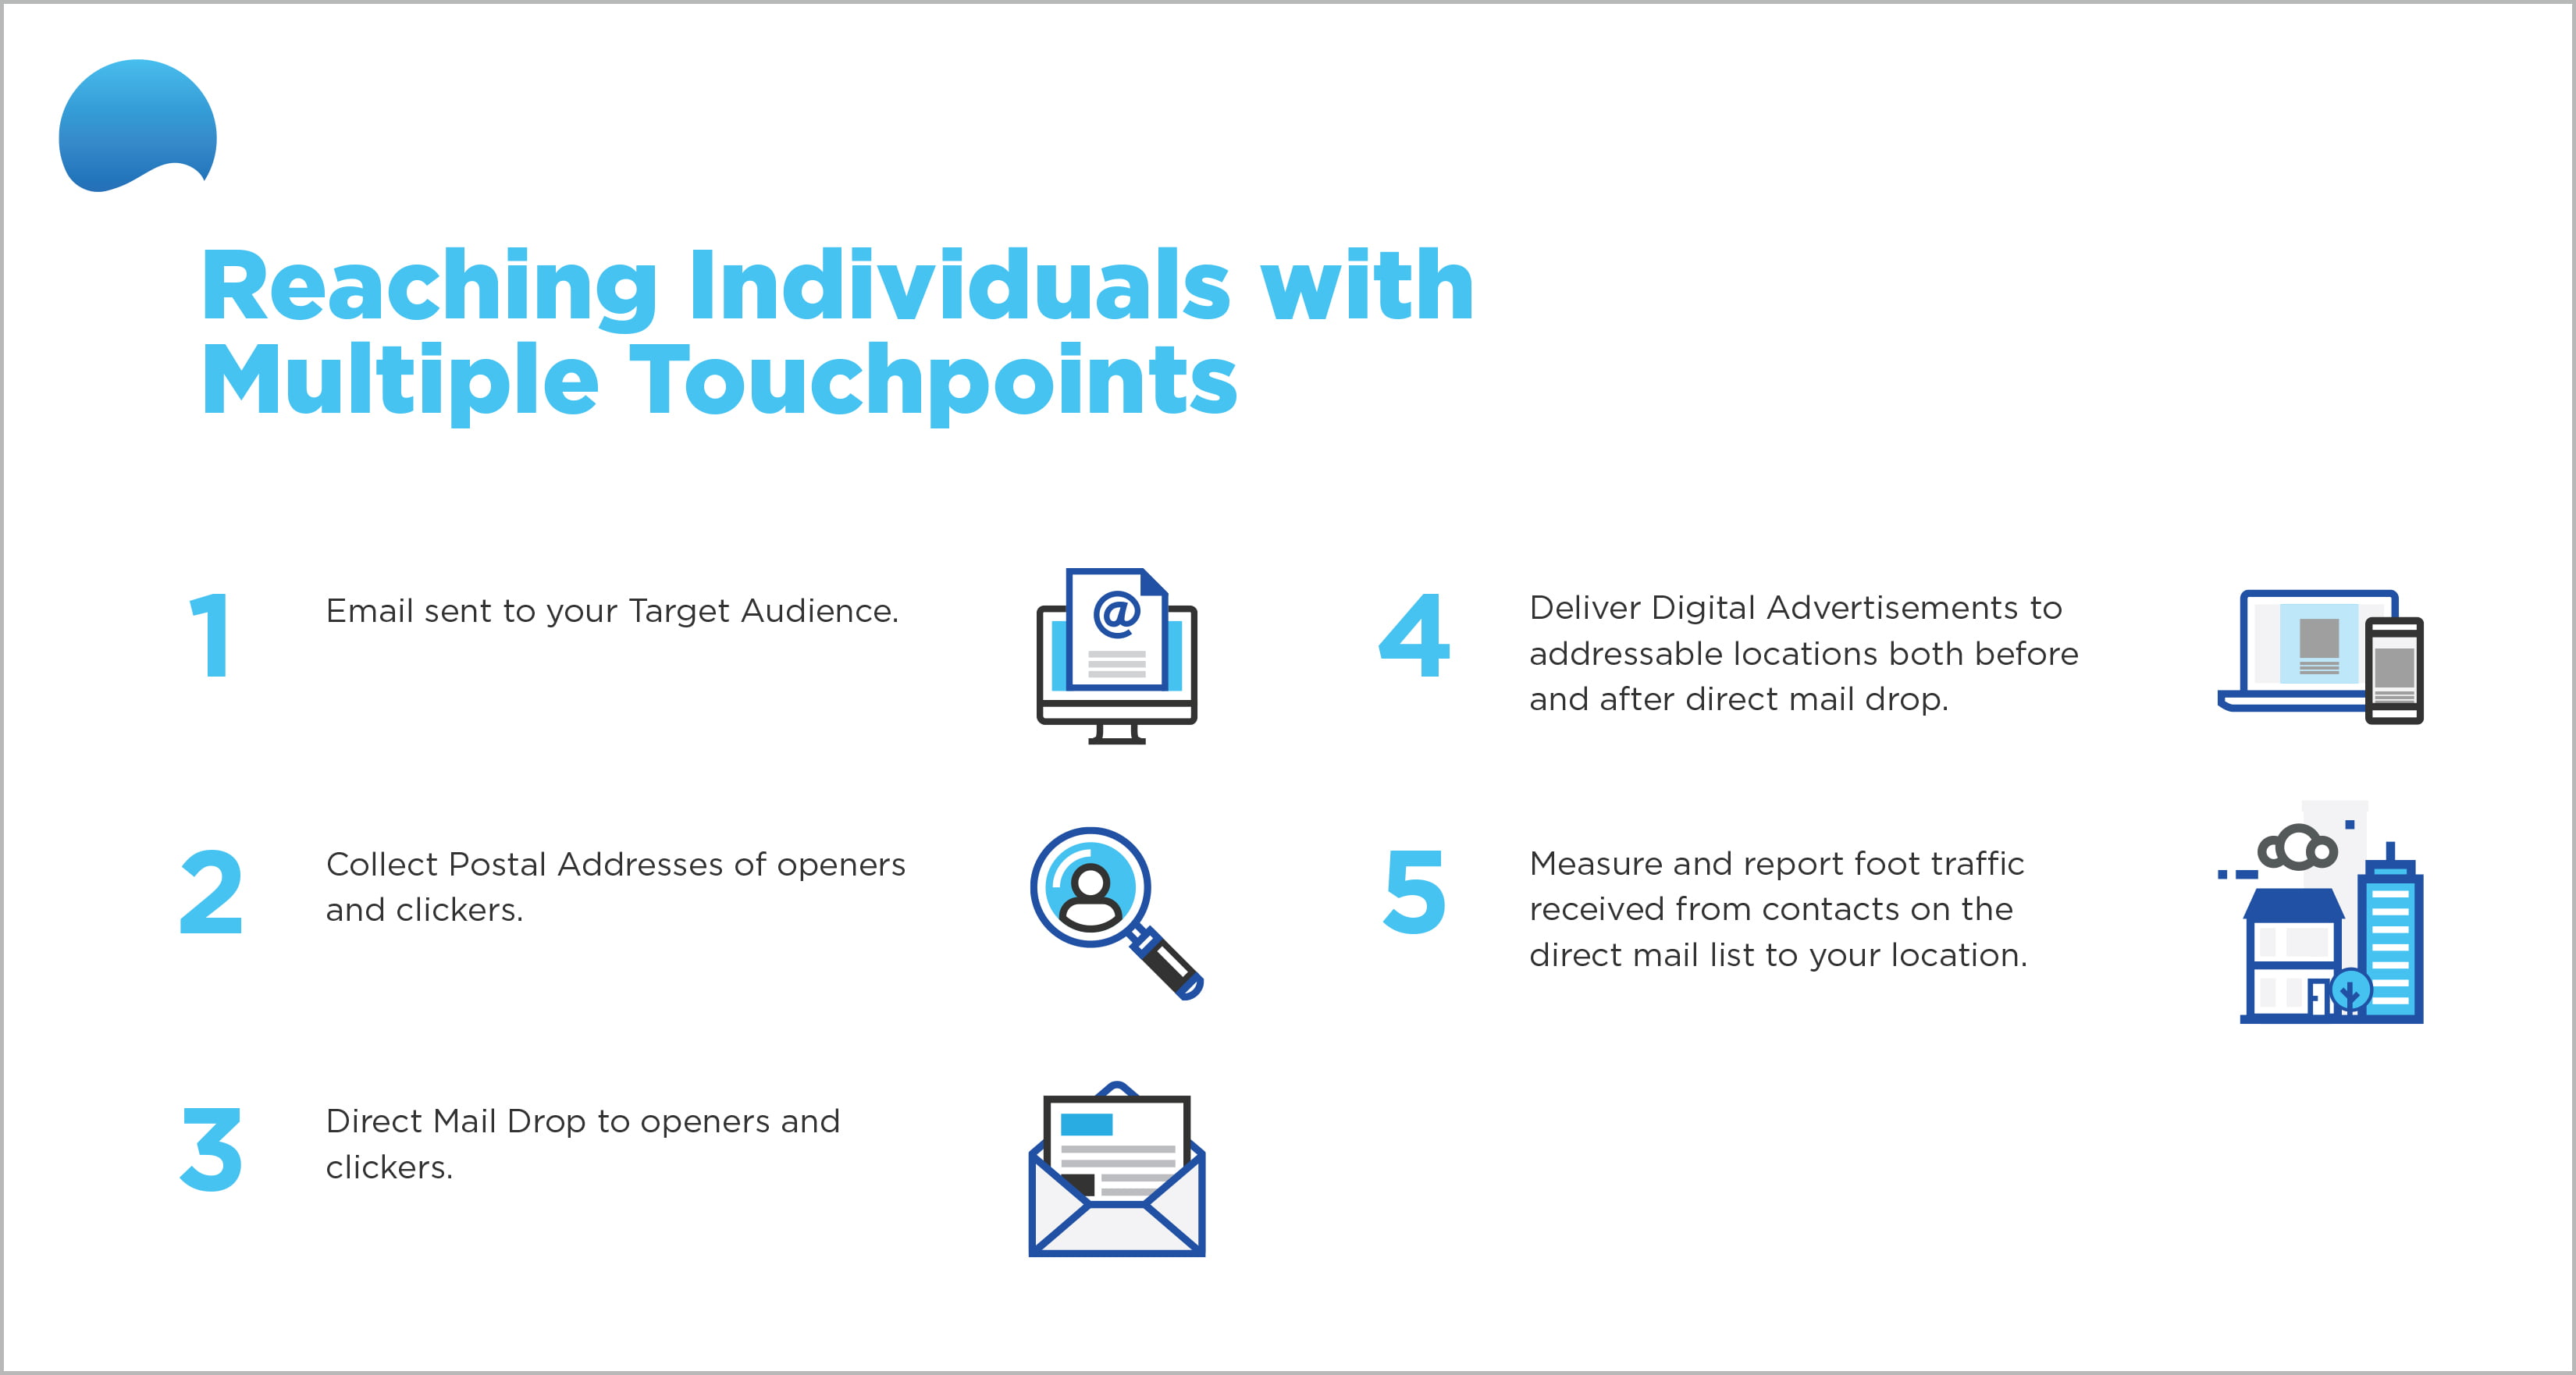
Processes
Explaining a series of steps can become convoluted and cumbersome without visual support. In addition to simply being more appealing to the eye, an infographic also forces you to simplify the way you convey a process so it’s clearer and more concise.

Timelines
At Netwave, we work with both business-to-business (B2B) and business-to-consumer clients. Our B2B clients often use timelines in their sales proposals to reassure prospects that they will get the job done in a reasonable timeframe. A spreadsheet is a great working document for mapping out a timeline, which we can then convert to an infographic with branding and creative design.
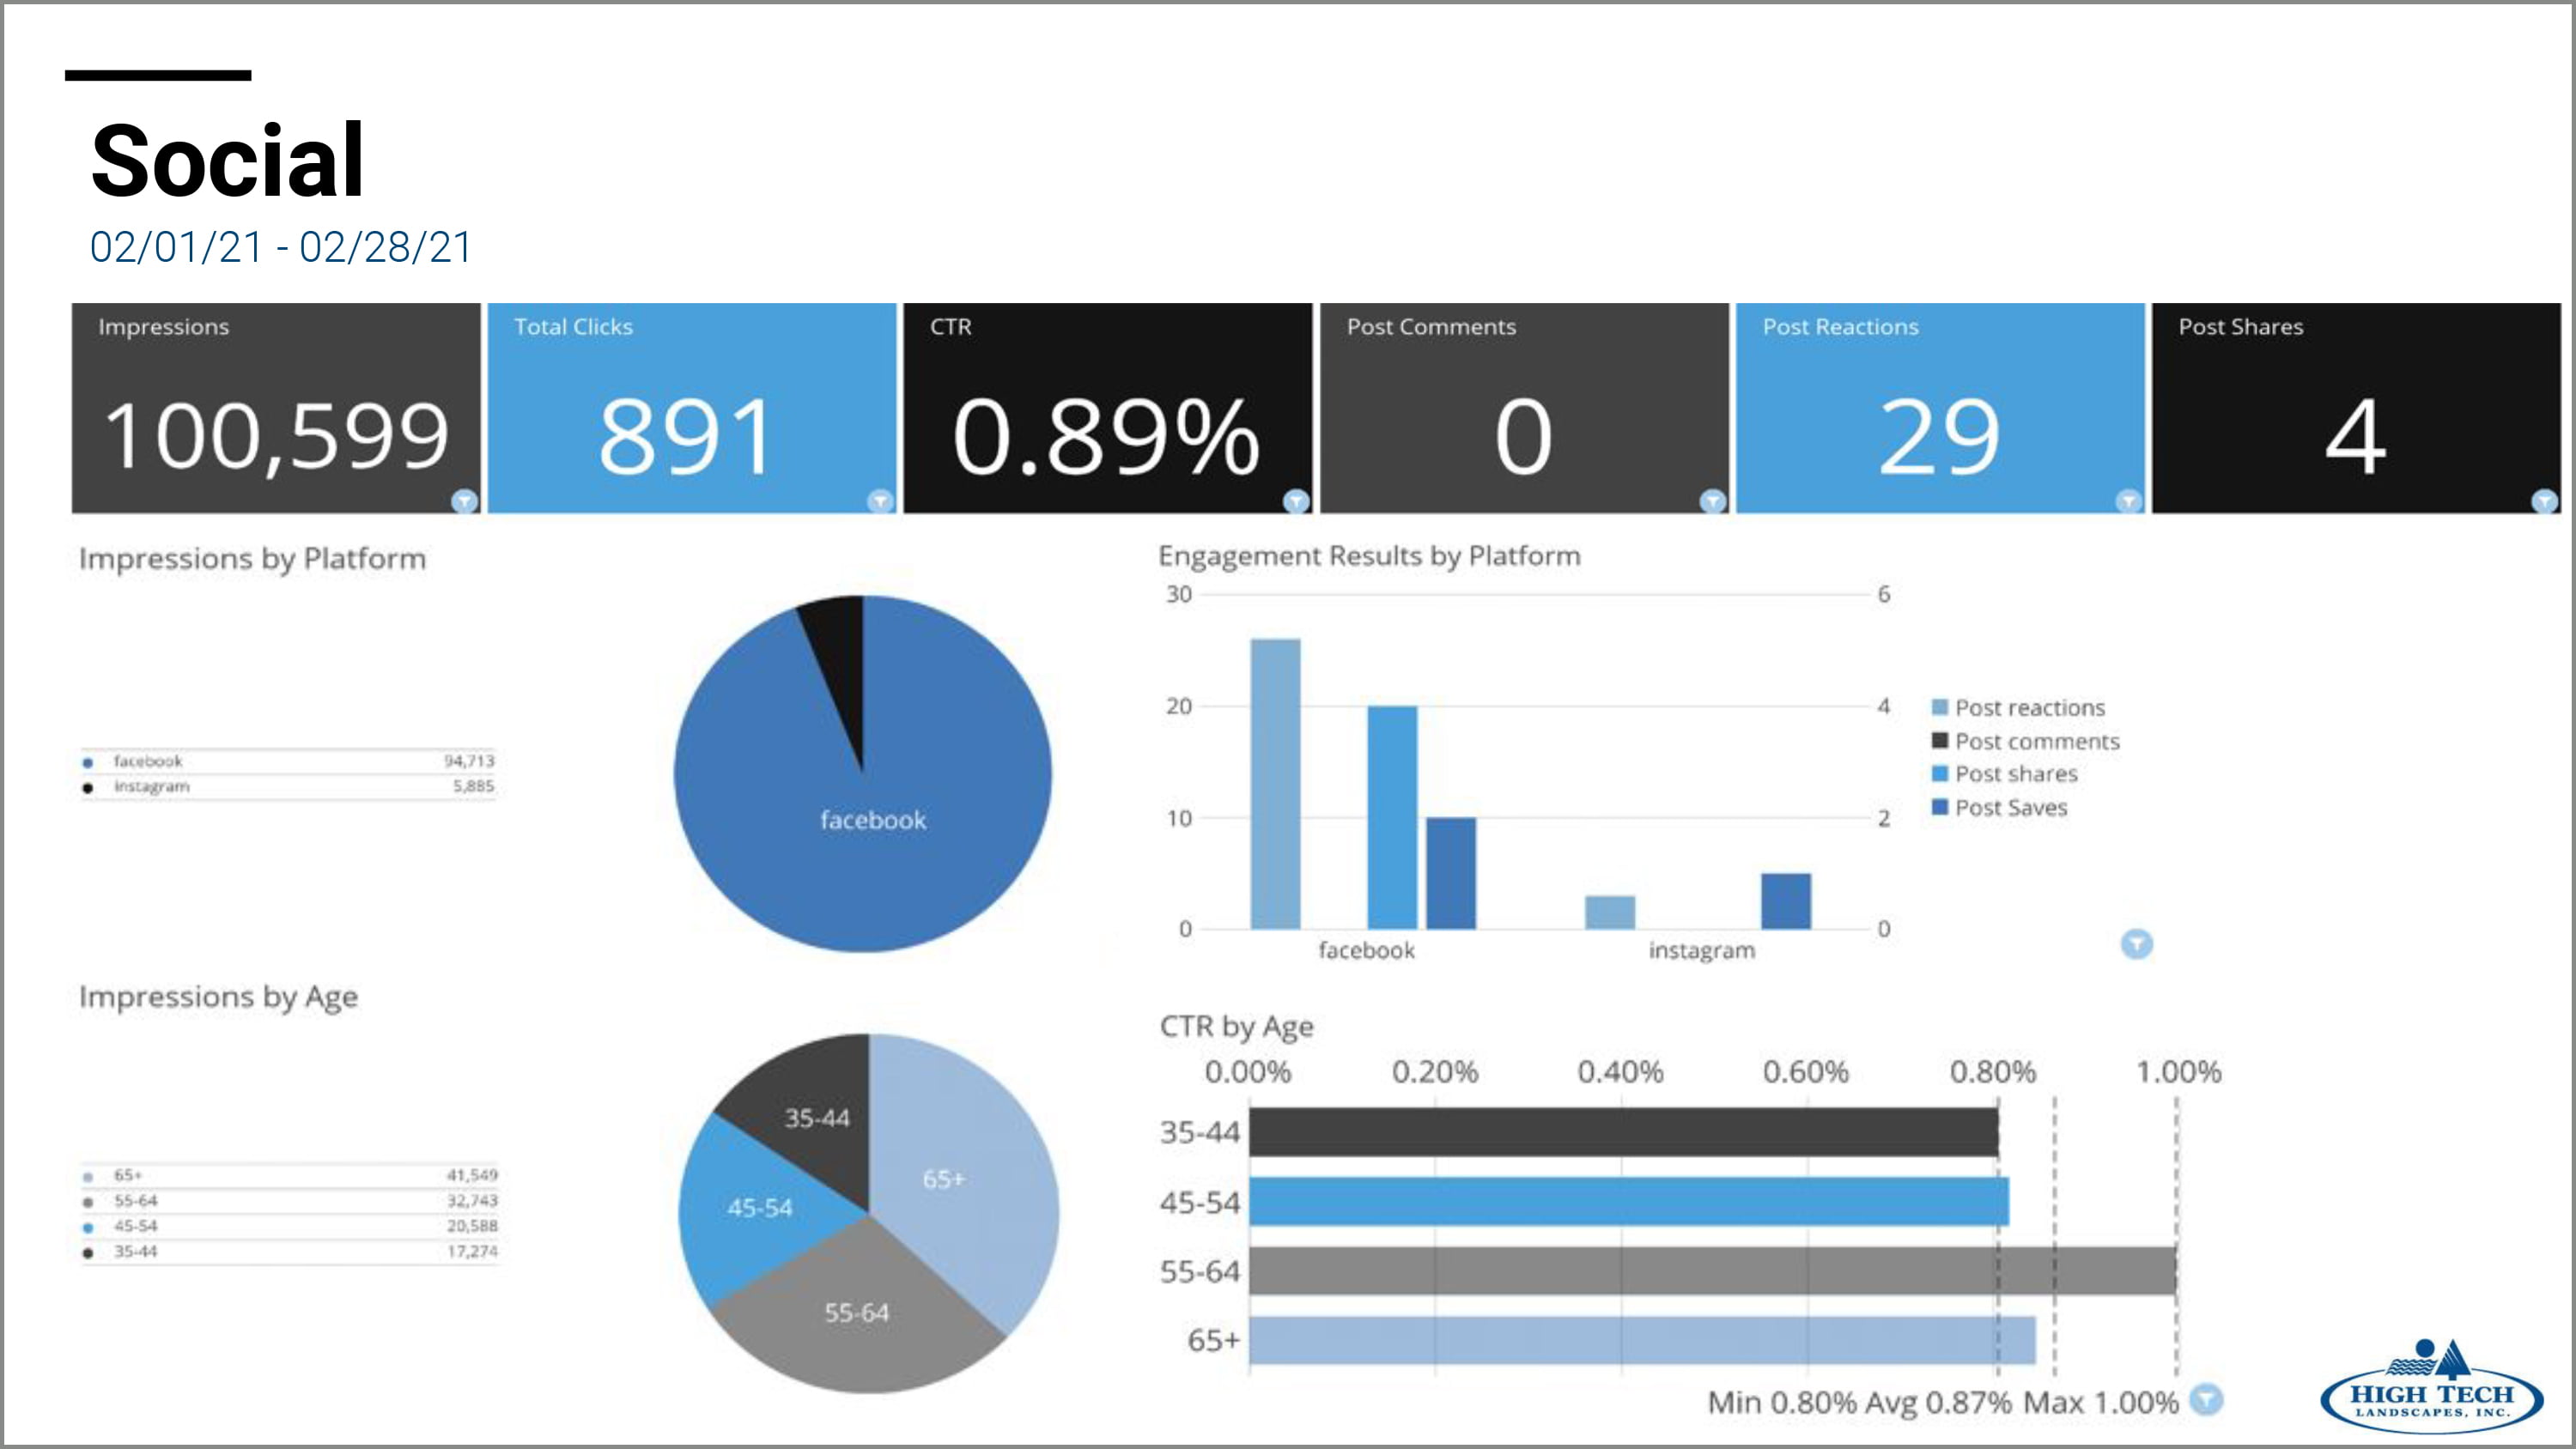
Statistics
Data is one of the strongest selling tools out there—but it can lead readers’ eyes to glaze over if it starts to feel like a research paper. Size up, spruce up and punch up those numbers with creative flair. According to Pearson, 65 percent of buyers are visual learners.

Comparisons
What sets you apart from your competitors? Comparison charts make for easy and persuasive infographics. Along the way, you’re completing the simple, yet pivotal marketing exercise of identifying your unique selling points.
Remember, infographics don’t just capture attention; they also drive conversions. Research from Springer shows that readers are over 300 percent more likely to complete a call to action (be sure to always add one) when directions are accompanied by visuals.
Offerings
Visual icons are ingrained in our digital lives, from clicking apps on our phones to opening programs on our computers to navigating web pages online. If you have multiple product or service lines, we can create an icon for each one to establish visual pillars in your branding.
Infographics need to be easy to understand and enjoyable to consume. We can’t cram too much into a visual, but we also need to make sure we get the information across. It’s always a fun challenge to find that perfect balance. The reward comes when we have a beautifully branded infographic that we can use in all sorts of ways, including on your website, social media channels, in email blasts, and throughout your marketing and sales presentations. Let’s get started.


